Sunday, 11 December 2011

Faraday rotation from API echos

The enhanced echos produced by the API effect can also be used to measure Faraday rotation, i.e., the propagation time difference between the two characteristic modes of radio wave propagation, which is dependent on several plasma parameters, but most importantly electron density. The artificial periodic irregularities are useful here, as they allow us to get strong enhanced backscatter from this region, which would otherwise give such a strong return.

Here is our first Faraday-rotation measurement from API echos. This is still a fairly raw data product, which must be further inverted into an electron density profile.

Faraday rotation measured using enhanced ionospheric backscatter from heating induced artificial periodic irregularities. This allows us to measure small electron densities, which are otherwise difficult to measure. The delay between O and X modes of propagation is given in radians, as a fraction of a radar probing wave cycle.
More post to come, as we have one more week of measurements to go.

Saturday, 10 December 2011

Mesospheric velocities with API

One advantage of the API method is that it allows high resolution vertical velocities to be measured between 50-120 km. Here is an example plot from our 9.12.2011 measurement. Around noon (7000 seconds in to the measurement) there are also some tropospheric echos.

Vertical velocities in the 60-120 km region measured using the API method with the EISCAT heater. 

Thursday, 8 December 2011

API

This week me and Antti Kero are up in Tromsø doing artificial periodic irregularity (API) experiments with the EISCAT heater, which has recently been upgraded to include a radar receiver.

The idea with the experiments is to first produce a standing wave in the ionosphere, which heats up the plasma, and creates small enhancements of electron density at lambda/2 intervals. These irregularities are then probed with short radar pulses, which are used to probe the decay time of the irregularities. From this, it is possible to determine several ionospheric parameters: ionospheric chemistry, electron density, winds, and neutral density.

5.423 MHz X-mode API echo. There is also a meteor head echo accompanied with a decaying trail echo in this measurement.
We managed to actually get an API echo on our first try! Here is a picture from our second day of measurements. This is an API echo with 5.423 MHz at X-mode heating and probing polarization. We were also lucky to observe a meteor head echo and associated trail echo.

Monday, 31 October 2011

GNU Chirp Sounder

This monday is yet another release from me. I'm publishing my code for ionospheric chirp sounding that I've been working on for a while. In lack of a better name, I'm calling it the GNU Chirp Sounder. It is a software defined radio based receiver for monitoring ionospheric sounders. The software is based on gnuradio and relies on Ettus research USRP2 and USRP N210 based digital receivers. The receiver can be used to receive the whole HF band (typically at 25 MHz bandwidth) simultaneously, and to receive multiple chirp sounders around the world simultaneously. The current receiver can be also used to perform single or dual polarization (channel) soundings. The dual channel mode can be used to determine the polarization form vertical soundings, or for angle of arrival measurements for horizontal soundings. It would also be trivial to add more channels for e.g., imaging or full polarization measurements.

The software consumes about 70% of one Intel Core i7 processor core, meaning that with a quad core processor, it is possible to simultaneously receive four different sounders, assuming that they are within the 25 MHz band that the receiver is tuned to.

What can I do with this? First of all, it is possible to use it to standard oblique ionospheric soundings, such as this one, between Sodankylä and Cyprus:
Oblique ionogram between Cyprus and Sodankylä. The Cyprus over the horizon radar installation transmits between 8 and 35 MHz with a 5 minute repetition period. This can be used to deduce ionospheric electron densities along the propagation path. 
Also, it is possible to perform standard vertical ionospheric sounding, such as this one:
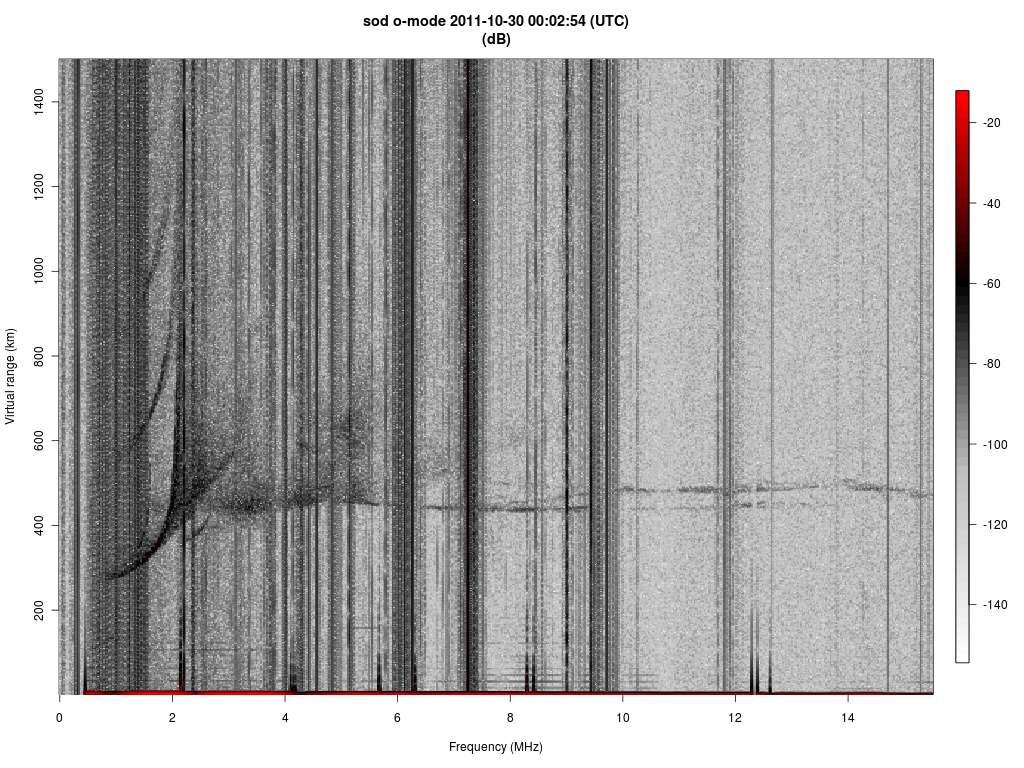
Vertical ionospheric sounding with the Sodankylä Ionosonde. The receiver is approximately 1 km from the transmitter. 
In the case of vertical soundings, it is possible use two antennas to determine the polarization of the vertical electromagnetic wave:
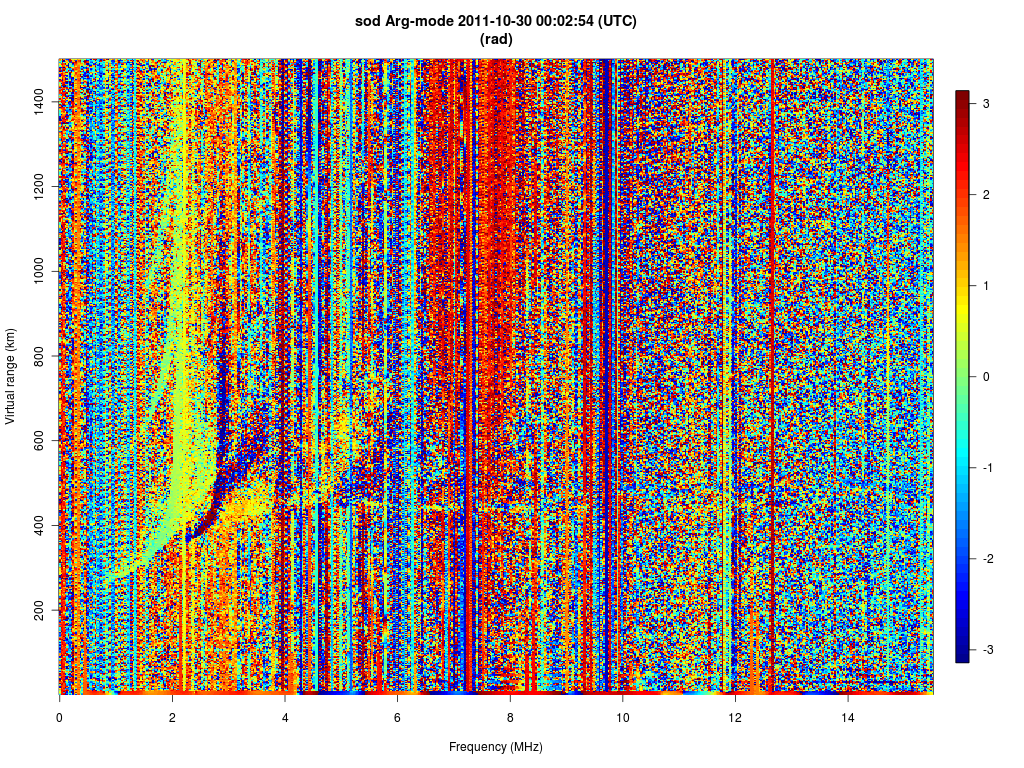
The phase difference between H and V polarizations. The greenish corresponds to O-mode of propagation and the blue corresponds to X-mode of propagation. 
As the receiver is relatively inexpensive and the hardware contains a GPS reference, it would be possible to perform 3D imaging of the ionosphere with this receiver, provided that there are enough of them.

Tuesday, 11 October 2011

GNU Ionospheric Tomography Receiver (Jitter)

I am releasing the ionospheric tomography receiver that I have been
working on for a couple of years. The receiver is not related to the
GNU Digital Beacon Receiver provided by Prof. Mamoru Yamamoto, which
can be used for a similar purpose. The receiver looks at Russian
Tsykada, US Radcal, and DMPSF15 satellites that transmit 150 and 400
MHz beacon signals. The FORMOSAT satellites should also be usable,
although they do not seem to transmit anything above Northern
Scandinavia, so I haven't been able to test them. From these signals,
it is possible to derive the relative propagation delay between 150
and 400 MHz (other frequencies can also be used with the receiver).
The propagation delay is approximately related with the line integral
of the ionospheric electron density between the satellite and the
receiver. With a large enough network of receivers, it is possible to
perform limited angle tomography of the ionospheric electron density,
which is what my group is planning to do with this receiver.

The receiver package that I am now releasing is intended for use with
such a large scale tomography receiver chain. The receiver is capable
of autonomous operation and it can observe multiple beacon satellites
simultaneously. The receiver is written with C++ and the relative
propagation delay calculation is performed using GNU R. A normal PC
will be able to perform all of these calculations, although you will
need about 4 GB of memory for the phase curve calculation part.

I am not releasing any tomographic reconstruction software yet, but
this might happen in the future.

Here is the web site for my receiver, which I am choosing to call
Jitter (GNU Ionospheric Tomography Receiver):

http://www.sgo.fi/~j/jitter/web/

The software is still in alpha stage, but it has been used with
several test receivers for several months of continuous operation. I
have used it successfully with usrp1 and two WBX daughterboards, but
also recently I have managed to get USRPN210 and TVRX2 working. The
receiver can be locked to a GPS reference, but this is not necessary.
If you are interested using my receiver, feel free to contact me.

Thursday, 6 October 2011

LOFAR Jülich DE605

Another international LOFAR station has been commissioned. Yesterday, 5th October 2011, the LOFAR station "DE605" was officially opened at Jülich in Germany. Their press statement read:

Bochum, Bremen, Jülich, 5 October 2011 – At last! The LOFAR station DE605 was officially opened on the campus of Forschungszentrum Jülich. The antenna station is an integral part of the digital radio telescope and European large-scale project LOFAR (Low Frequency Array). It will contribute to measuring long-wave radio signals from the dawn of the universe. LOFAR DE605 was built in cooperation between Ruhr University Bochum, Jacobs University Bremen and Forschungszentrum Jülich with funds provided by the Federal Ministry of Education and Research (BMBF).

This new station is one of five located in Germany. There are now eight operational international stations and, although there is still a lot of commissioning work to be done, it is great to see that the network has expanded so far so fast. The photograph below shows the newly completed station.

LOFAR station DE605. Image: Forschungszentrum Jülich

The opening of the facility is great news not just for the Bochum/Bremen/Jülich team, but also for the entire LOFAR facility. The addition of new baselines will improve the image quality and the additional collecting area will provide a valuable sensitivity improvement.

Congratulations to the German team on the completion of their new station!

Press-releases:

Friday, 30 September 2011

LOFAR-UK observes the active sun

Over the last few days, our Sun has been very active. Apart from the dedicated solar instruments monitoring this activity, we've also been able to observe it with the LOFAR radio telescope at Chilbolton. This facility comprises two fields of small antennas, that link together to perform as a powerful VHF radio telescope. Although it is also possible to link the LOFAR system in the UK with others across Europe, on the 28th September 2011, it was operating independently.


At 16:10 UTC (= 5:10 pm local time), LOFAR Chilbolton was used to record an 'all-sky' image. Even before calibration and analysis, this image shows the bright objects in the radio sky. On the left-hand side of the image there are, from top to bottom, Cassiopeia-A (a supernova remnant), Cygnus-A (a radio-galaxy) and the broader region which is the centre of our own Galaxy. However, to the right of the image, the Sun can be seen with extremely strong intensity, just before it set below the western horizon.

The image shown was made using the UK608 LBA. It demonstrates what a LOFAR station is capable of, even when working alone and independent of the main International LOFAR network. The image is not calibrated nor cleaned in anyway. The observations were made by Menno Norden (ASTRON), and the report by Derek McKay-Bukowski (STFC).

The web release is also available from STFC's "RAL Space" website: http://www.stfc.ac.uk/RALSpace/Areas+of+expertise/Astronomy/LOFAR-UK/In+the+news/37611.aspx