On November 27th, somebody stepped on our band here at MIT Haystack Observatory. At first I thought that there must be something wrong with the new radar echo deconvolution program that I have been developing. But a month ago the same program worked perfectly, and no major changes were made since then.
On the next day there was a routine radar calibration run, which seemingly looked ok in terms of electron density. However, there was a suspiciously uniform non-zero Doppler velocity across the altitude profile during the whole run.
I went back to the raw voltage and calculated spectra from range gates at ranges where no ionospheric return would be expected. Sure enough, there was strong radio interference right in the middle of our radar band at 440 MHz.
The signal looked like it had ~0.5 ms baud lengths and frequency shift keying modulation on it.
As an emergency plan of action, we considered moving our center frequency to 440.4 MHz to navigate around the jammer. However, by the next day, the jammer had drifted in frequency to 440.4 MHz from 440.2 MHz. In the following days, the signal continued randomly walking between 439.9 and 440.4 MHz, our whole licensed band.
Not only was the signal stopping our operations, it also occasionally looked nearly like an F-region ionospheric return, a double humped ion-line spectrum. This is shown in the picture below.
 |
| Screen capture while war driving to locate the jammer. Hey, it has a double humped spectrum, just like the F-region ionospheric return, and it has approximately the same width! Frank's comment: "I don't like this jammer". |
Because the signal was strong, we suspected something on the observatory grounds might be causing it. However, despite multiple attempts, we failed to pick up the signal with a yagi antenna anywhere on the Hill. Doing an azimuth scan with the MISA antenna suggested that the signal was coming from the south west direction. Because we failed to find the signal on the hill, it was possibly coming from further away.
 |
| Azimuth scan of interference on the MISA antenna, indicating that the signal is arriving from the Southwest direction. |
At this point, we loaded up a black SUV with a bunch of gear: a directional antenna, an omnidirectional roof mounted antenna, an RF front end (hastily built in a shoe box), and some real-time spectrum analysis software.
 |
| Mobile RFI detection unit, with our expert RF gumshoe, Will Rogers. |
On the first night, our sleuth Will drove around and caught a weak glimpse of the same jammer signal in Leominster on I-190, about 20 km from our radar. A yagi antenna scan indicated that the signal was coming from further West.
 |
| Instrumenting the vehicle. The MISA antenna in the background. |
A few days later, a more instrumented war driving expedition took place with Frank Lind, Will Rogers, and Juha Vierinen. This time we had GPS logging and recording of spectra. After a day of direction finding and driving around, we were fairly confident that the source was between Leominster and Mt. Wachusetts in Leominster State Forest, about 30 km from our radar. However, we still failed to locate the source.
 |
| RFI signal strength as a function of geographic location. |
On the afternoon of the next day, on his way home, Will Rogers stopped by at the hot spot that we had identified near Stuart Pond. He obtained several precise angle measurements using a yagi and a magnetic loop antenna. He also recorded observed signal power. The results are indicated in the picture below.
 |
| Angle of arrival measurements. |
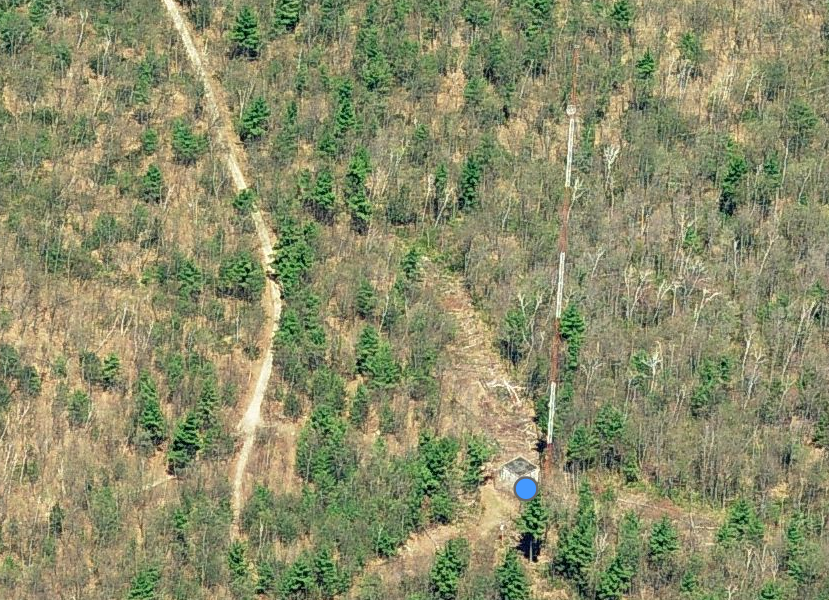
The results indicated that the source of the interference must be somewhere in the forest, possibly closer to locations 2 and 3, than 1 and 4. After some analysis of the data using satellite and aerial photographs, the only man made object in the forest, a radio tower, was identified. This was a huge relief, as one theory was that the source might be a broken animal tracking collar.
 |
| Incoherent scatter radar echo simulator. |
This tower was soon identified as a local FM radio station. The engineer responsible for the station informed us that he had a few weeks ago installed a FSK telemetry link operating at 450 MHz. This was consistent with the appearance of the interference. The faulty telemetry link was aptly replaced by the engineer, and the interferer finally went away!
 |
| At about 2013.12.13 13:00 LT, the interference finally goes away as faulty telemetry radio link is replaced on the radio mast in Princeton. |
During this episode, we learned a lot about radio direction finding in practice. This will come in handy in the future, as interference is abundant at Haystack.
For software, we used the gnuradio framework. We mostly used the waterfall and FFT spectrum graphical sinks, as the signal was drifting around in frequency a lot. For the war driving, I used a custom block that I wrote, which simply calculates power spectra using FFTW, and records averaged results to disk. I then used post processing of this to calculate the RFI power at any given location. I recorded the GPS coordinates with my phone.
 |
| Hastily built front end and rtlsdr digital receiver. The other output can be connected to another receiver, such as a USRP, a HAM rig, or a spectrum analyzer. |
For hardware, we used both rtlsdr dongles, and a USRP N200. The rtlsdr dongle and the gnuradio FFT spectrum sink actually worked surprisingly well for direction of arrival determination. The RF front end consisted of a low noise amplifier and a filter. As direction finding antennas, we used two different yagi antennas, and a magnetic loop antenna. For war driving, we first used a roof mounted discone antenna, and later a magnetically mounted quarter wave dipole.
 |
| Yagi antenna (above) used to direction finding by maximizing signal power. The magnetic loop antenna (below) is used to find the angle of arrival by minimizing the signal power, as the antenna radiation pattern has a sharp null in the direction of the loop axis. |
I had already prepared software to record absolute time of arrival of the interferer using GPS syncronized USRP receivers at several independent locations. However, good old fashion detective work with directional antennas managed to provide us with enough clues to solve the problem before we got to deploy our time of arrival setup. Well, maybe the software and receivers can be used to hunt down the spike-like interference that we see every now and then.

 The signal looked like it had ~0.5 ms baud lengths and frequency shift keying modulation on it.