
Anyway, today's interesting data was discovered in a sort of backwards way. We found out the source first, and then went back into the data to see the effect. However, for the purposes of making an entertaining web log (sic) we are presenting it the other way around.
So, starting at 13:06:12 UTC on 27th June 2013, something very strange happened in the data stream on RCU 035.
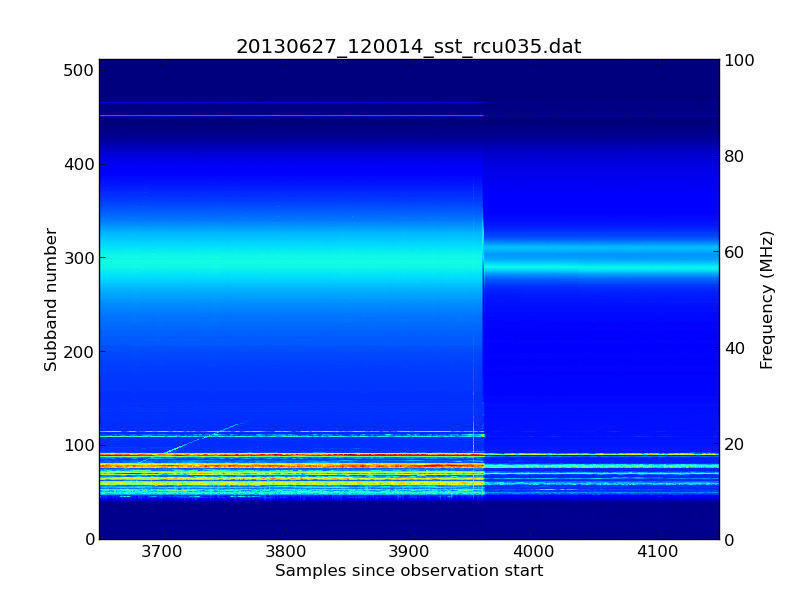 |
| A strange change in the signal level (click to enlarge). |
The above spectrogramme is plotted from a single subband statistics (SST) file. The horizontal axis is time and the vertical axis is frequency. The jet colour scheme shows the log of the received power (dark blue is weak; light blue is stronger).
The transition between the working and failed states took approximately 3 seconds.
We saw the same effect in RCU 034 as well, although here the transition was a bit faster (the data remained good for the first second as RCU 035 was deteriorating and then it changed rapidly to give the same end effect). However, there was no change in any of the other 94 RCU channels.
So, all you LOFAR experts out there... can you tell what caused this abrupt step function in the data?
No comments:
Post a Comment
Note: only a member of this blog may post a comment.