Tuesday, 31 December 2013

New Year's Eve

Well, that's about it for 2013. It has been a hectic, frantic year with lots going on and all sorts of new discoveries and adventures. To all our dedicated readers, thank you for making 2013 our most successful and for all your positive and encouraging comments.

Today at the institute, we had a little celebration for the 100th anniversary of geophysical measurements (more on that tomorrow).

But tonight's "photograph" is a close-up of the inside of an HBA tile, shot at midnight in the depths of a polar night, with no moon, overcast skies and a complete power failure. The temperature outside is -15 (although those tiles keep it at a toasty -10 C inside them).

This photograph is intentionally black.
(Okay... so we made this one up.)

:-)

Thanks for 2013!

Best wishes for the new year!!

Monday, 30 December 2013

Unreal photographs

There are some stunning photographs of the aurora, wildlife and the Arctic landscape these days. Better cameras, more photographers and better knowledge help. And, sure enough, the opportunities to catch those stunning moments increase. With the Internet, these are readily distributed and reach a huge audience.

Sadly, however, there are a number of altered photographs out there, which distort our perception of reality. These photographs may not be intentionally altered to deceive, but the original captions, the original context and the original audience is lost as they are circulated about the web via a plethora of social media channels.

It is only by actually having been in these places and seen these things that a few of us have the perception to recognise such alterations. Like the old depictions of lions by northern Europeans in the medieval period, they are laughable if you know what a real lion actually looks like.

But we have this with many modern Arctic photographs. Sure, the quality of the alteration is sophisticated, but many who do not know better see this as reality... which it is not.

Allow me to give an example.

In the last week or so, there have been a very popular image doing the rounds of a polar bear in front of the aurora. Of course, the world has been "ooooh" and "aaaahh" and "what a beautiful photograph". Here is the first version that I saw, posted by Animal Planet (@MeetAnimals on Twitter)...


Posted on Twitter by @MeetAnimals

As an astronomer/geophysicist working in the Arctic, I'm used to seeing the northern lights. I also have done some astrophotography (both as an amateur and professionally). What immediately struck me about the image was the contrast in the lighting and the implied exposure-time requirements. Something didn't look right.

Because the Earth rotates, the sky appears to move. To get the stars to appear as pin-pricks, you need a relatively short focal-length on the camera, or you need to have a tracking platform, or you need a really big lens which  has huge light-gathering power. The lens for the star field was definitely wide-angle, as you can see part of Ursa Major at the top and the bright star Alpha Boötes (above and to the left of the bear's head). This puts the vertical field-of-view at about 60 degrees. At a quick guess, I'd estimate that would be a 28mm to 35mm lens. That's a fairly wide-angle lens.

So, to the bear...

For a wide angle lens, the bear doesn't seem right. It looks too "flat", meaning that it was taken with a long focal length telephoto lens. Not surprising... given that it is a bear! Then there is the exposure. The lighting levels are not consistent with what I know real aurora to look like. The diffuse "grey" light implies a uniform white light... probably an overcast day or similar.

Given the diffusion of the aurora, this would be a fairly long exposure to get those intensities. That also matches up with the star images. In fact, you you look carefully, there are stars down to Mag. 6.5... for example I can make out HIP 67103. This is below naked-eye visibility. The bear would have to be still for quite a while there.

While the photograph was not impossible (I could contrive a lens/lighting combination that might result in something like that), it seems HIGHLY unlikely. Too unlikely.

I was suspicious.

So, I started trying to find the original. What I wanted to know was the where/when that the photo was taken. Was it in the right place? Did the star patterns match? And... most importantly, what was the camera and lens? Knowing that would help clinch whether this was good photography or good photoshop.

Then, during my search, I found this...

Found via Internet search.

Same bear, but mirror image. And a different sky-scape. This one looks even more unlikely, in terms of exposure inconsistency, but the presence of the first image clinches it.

These are not real.

I checked the original site and, it most clearly states in the fine print that:

DIGITAL COMPOSITE: Aurora borealis swirls across the sky over a polar bear standing on a rock on the tundra. (composite of two images)

... which is great! They are making it quite clear that this is a composite image, which is perfectly valid. That's art, after all.

So, the problem is in the "chinese whispers" that saw the image propagate across the Internet. With each step, it becomes more and more removed from the original and people start taking it at face value to the point where some are talking about nominating it for "photograph of the year".

By no means should one consider composites as problematic. But what is disturbing, is that those who propagate it fail to mention (or do not even know) that it is such an image. The result is a distorted perception of reality in the minds of many who do not have the background or experience to recognise it for what it is. This is a harmless example, but there are implications...

When you know a topic and you see the way that it is portrayed across the media (meaning Internet and other communication channels), you begin to wonder how thin and shallow must all the other things be that we see there and take for granted. Every news report. Every article. Every web post.

The key cornerstone of science is not facts or knowledge, but critical thinking. Questioning and checking. Not knowing, but wanting to find out. And taking nothing at face value, but verifying. When we at least know something, we are given the tool to recognise things and know where to direct our interrogation.

In the meantime, we need to be wary...


... there are a lot of polar bears out there!


References
  • Image 1 -- http://photos.alaskaphotographics.com/
  • Image 2 -- http://photos.alaskaphotographics.com/

Sunday, 29 December 2013

Beyond the wire

Today's icy photograph is taken on the landscape beyond the KAIRA reindeer fence.

The world beyond the wire (Photo: D. McKay-Bukowski)

Saturday, 28 December 2013

RFI investigations

On Wednesday, we reported on some strange RFI (radio-frequency interference). Today we've a few more leads on our investigation.

The following aspects have been noted:
  • The events appear equally in both X- and Y-polarisations. 
  • The events last between 5 and 10 minutes. However, they are not always the same duration. 
  • The events are broadband, but seem to be stronger at some frequencies. This is not linear nor monotonic across the different frequencies. 
  • The rise is generally quite gradual, although sometimes there is an initial step function to start. 
  • The end of the event is extremely abrupt.
During the observations, correlator files were being acquired. This allows us to check on the direction of the RFI by forming an all-sky image. The following is an example showing an RFI event.


It seems that the source is always the same direction (az = approx. 150 degrees) and is always on the horizon. Using the KAIRA landscape in Stellarium, we can check on this direction.


The beamsize at the frequency of the all-sky image above is approx. 8 degrees. This is not huge, but is sufficient to show that the source is unlikely to be Saana (there is a radio transition station on the mountain there at az=131).

However, at az=150, there are LOTS of potential sources: the customs (Tulli) station, IRIS, Retkeilykeskus, the village centre, the Biol.Asema, et al..

Investigations continue...


Friday, 27 December 2013

Snow driving

Normally, we show winter photographs during the daytime... well, er, at least during the midday twilight, for what it is worth. However, as you might imagine, much of the time is dark and snow and poor visibility. That can be tricky to photograph. However, today we've something that looks a bit more typical.

A more typical view of the KAIRA site in winter. (Photo: D. McKay-Bukowski)

Actually, on this particular occasion, we managed to get the vehicle stranded. The snow was soft and when we had trouble starting it, we over spun the wheels, which dug down and left the vehicle stranded on a mini-snow-hill.

It took about 3 hours to dig it out.     :-P

Thursday, 26 December 2013

Inari landscapes

Today we have one last photographs from the week of the Inverse Days 2013 conference. (It seems like yesterday... but also like an eternity ago!). We hadn't shown any photographs of the surrounding landscape, but today we have a chance to put that right.

Trees in the wilderness (Photo: V. Junttila)

A corner of Lake Inari (Photo: V. Junttila)

Scraggly branches... look carefully to see
the bird perched there (Photo: V. Junttila)

Gloaming behind the sparsely wooded hillsides. (Photo: V. Junttila)

Wednesday, 25 December 2013

Strange RFI

Today we've been working on a strange RFI (radio-frequency interference) problem. Inspired by Juha's recent investigations and wishing to resolve this problem so as to hopefully clean up our own data, we've gone back to start working on this problem again.

The first step is to actually understand what we have. Initially, the problem was noticed by Antti during some of this data reduction work on the riometry data that we've been taking. However, others have seen it as well in astronomy experiments. So far the problem has only showed up on the low-band antenna (LBA) array, but we're trawling data as this is being written so as to see if it occurs in higth-band data too.

The characteristic of this effect is a gentle rise in RF power, followed by a sudden drop. In order to carry out a full investigation, we need to capture one of these events under favourable conditions. This occurred during some Tsys calibration observations in November 2013.

Time series for one aerial for a small range of subbands.

In the first figure, the drops are due to changes in pointing direction, causing a momentary loss in power. The problems are the ones that rise up like serrated spikes (we refer to them as dragon's-teeth).

The nature of these is actually broad band, but not completely. They show up at several frequencies, but with a broad pattern at each. Olaf suggests that this might be due to the fact that there is a very high-rate time variation, which is something we'll need to investigate.

A 2D spectrum showing the multi-frequency nature of the RFI.
Note also the large areas of shortwave radio interference.

In any case, this is a very puzzling phenomena. But one which we are determined to figure out. Thanks to Menno, Antti, Juha, Olaf and Richard for helping out!

Tuesday, 24 December 2013

Snowscape at KAIRA

Today's photograph is of the snow and ice at the KAIRA High-Band Antenna array.

Snow and ice. (Photo: D. McKay-Bukowski)

Monday, 23 December 2013

Manx-arrays revisited

Yes, it is Monday again and time for something a bit technical to kick us into the new working week.

A few weeks back we had a posting about the so-called "manx-array" layout for baseline distributions. Well, our colleague Björn Gustavsson (UiT) has provided today's figure. He points out another interesting fact about the manx-array, namely that it is possible to cascade it into a fractal Cantor-dust type configuration -- which gives fairly nice base-line distributions too!


Cascading manx-arrays. (Image: B. Gustavsson)


In the diagram, the antenna locations are on the left-hand graphs, and the uv-coverage (or baseline-distribution) is on the corresponding right-hand side graph.

Exercise for the reader... are there any redundant arrays? And, is there a cascade ratio that is optimal for an infinite distribution?

Sunday, 22 December 2013

ASTRON/JIVE 2014 Summer Student Programme

ASTRON and JIVE announce the availability of a limited number of grants for their 2014 Summer Student Programme. The Programme enables astronomy students (graduate or advanced under-graduate) to spend the summer (10-12 weeks) at the Dwingeloo Observatory, conducting astronomical research under the supervision of ASTRON and JIVE staff members. Possible topics of study include radio galaxies and quasars, aspects of observational cosmology, continuum and line emission/absorption from normal and starbust galaxies, faint radio sources, pulsars, molecular clouds, cosmic magnetism, as well as working with LOFAR data. The actual project the successful candidate will work on will be defined after arrangement with the local supervisor.

For details and to apply for the summer programme, please visit http://www.astron.nl/astronomy-group/astronjive-summer-student-programme.

Saturday, 21 December 2013

LBA at noon

Today's photograph of the KAIRA LBA was taken recently. The kaamos noon twilight is always a beautiful time of day.


The KAIRA LBA field. (Photo: D. McKay-Bukowski)

Have a lovely, peaceful solstice!

Friday, 20 December 2013

Winter reindeer fence

Just a poignant Friday photograph of the frosty landscape in the depths of winter. This shot is looking across to the reindeer fence along the southern edge of the KAIRA site.

The KAIRA reindeer fence (Photo: D. McKay-Bukowski)


Normally the fence does a good job of preventing the reindeer from getting in (we know they like to use the HBA array!). But we suspect that some reindeer fly around this time of year. Let's see how we manage at keeping them out this yuletide!

Thursday, 19 December 2013

Sajos

Today we have a couple more photographs from the Inverse Days 2013 conference, which was held in Inari, Finland. The venue was the "Sajos" Sámi Cultural Centre. At night, the building is lit up and it looks very impressive in the inky blackness of the Arctic night.

The entrance to Sajos at night. (Photo: D. McKay-Bukowski)

Illuminated etched-glasswork above the main doors. (Photo: D. McKay-Bukowski)

Wednesday, 18 December 2013

Repatching the RF-container data network

Recently, we discovered a bit of a problem with the recording of high-speed radar data at KAIRA. We have had some problems with the recording of UDP packets via our local data computer kaira01. As part of the testing for the installation of the new QNAP data recorders, we were also testing the UDP packet reception on not just the QNAP box, but also one of the other KAIRA acquisition machines, kaira03. As this work was being done in the RF-container, we were physically in the container and running the software from there.

During this time, we noticed that simultaneous dropped packets on all four lanes would occur at precisely the moment that the air-conditioning cuts in. Suspecting possible power spikes somehow getting into the network we traced the cables. These turned out to be quite long (two were 7.5 m and the other two were 10 m) and surplus length was coiled in the sub-floor space under the racks close to some of the power distribution cables.

We therefore suspect that some packet loss might have been caused by spikes induced into these cables corresponding to power fluctuations. At the time we were checking this, we also noticed that the cables used were CAT-5, which are only rated to 100 Mbit/s.

We have now replaced all four cables with 3-m CAT-6 cables (rated to 1 Gbit/s). These cables route directly through the signal cable guides on the back of the racks and do not go anywhere near the sub-floor space.

Re-patching work in the RF-container (Photo: D. McKay-Bukowski)


We now see a noticeable improvement in packet reliability, although we still see the occasional lost packet.

Tuesday, 17 December 2013

Winter trees

It must be tough being a tree up here at Kilpisjärvi. Dark, cold and windswept. Today's photograph is of a couple of birch trees on the KAIRA site, taken during the midday twilight.

Trees at the KAIRA site during kaamos (Photo: D. McKay-Bukowski)

Monday, 16 December 2013

Perfect Incoherent scatter radar jammer

On November 27th, somebody stepped on our band here at MIT Haystack Observatory. At first I thought that there must be something wrong with the new radar echo deconvolution program that I have been developing. But a month ago the same program worked perfectly, and no major changes were made since then.

On the next day there was a routine radar calibration run, which seemingly looked ok in terms of electron density. However, there was a suspiciously uniform non-zero Doppler velocity across the altitude profile during the whole run.

I went back to the raw voltage and calculated spectra from range gates at ranges where no ionospheric return would be expected. Sure enough, there was strong radio interference right in the middle of our radar band at 440 MHz.
The signal looked like it had ~0.5 ms baud lengths and frequency shift keying modulation on it.


As an emergency plan of action, we considered moving our center frequency to 440.4 MHz to navigate around the jammer. However, by the next day, the jammer had drifted in frequency to 440.4 MHz from 440.2 MHz. In the following days, the signal continued randomly walking  between 439.9 and 440.4 MHz, our whole licensed band. 

Not only was the signal stopping our operations, it also occasionally looked nearly like an F-region ionospheric return, a double humped ion-line spectrum. This is shown in the picture below.
Screen capture while war driving to locate the jammer. Hey, it has a double humped spectrum, just like the F-region ionospheric return, and it has approximately the same width! Frank's comment: "I don't like this jammer".
Because the signal was strong, we suspected something on the observatory grounds might be causing it. However, despite multiple attempts, we failed to pick up the signal with a yagi antenna anywhere on the Hill. Doing an azimuth scan with the MISA antenna suggested that the signal was coming from the south west direction. Because we failed to find the signal on the hill, it was possibly coming from further away.
Azimuth scan of interference on the MISA antenna, indicating that the signal is arriving from the Southwest direction.
At this point, we loaded up a black SUV with a bunch of gear: a directional antenna, an omnidirectional roof mounted antenna, an RF front end (hastily built in a shoe box), and some real-time spectrum analysis software.

Mobile RFI detection unit, with our expert RF gumshoe, Will Rogers.
On the first night, our sleuth Will drove around and caught a weak glimpse of the same jammer signal in Leominster on I-190, about 20 km from our radar. A yagi antenna scan indicated that the signal was coming from further West.
Instrumenting the vehicle. The MISA antenna in the background.
A few days later, a more instrumented war driving expedition took place with Frank Lind, Will Rogers, and Juha Vierinen. This time we had GPS logging and recording of spectra. After a day of direction finding and driving around, we were fairly confident that the source was between Leominster and Mt. Wachusetts in Leominster State Forest, about 30 km from our radar. However, we still failed to locate the source.
RFI signal strength as a function of geographic location.
On the afternoon of the next day, on his way home, Will Rogers stopped by at the hot spot that we had identified near Stuart Pond. He obtained several precise angle measurements using a yagi and a magnetic loop antenna. He also recorded observed signal power. The results are indicated in the picture below.
Angle of arrival measurements.
The results indicated that the source of the interference must be somewhere in the forest, possibly closer to locations 2 and 3, than 1 and 4. After some analysis of the data using satellite and aerial photographs, the only man made object in the forest, a radio tower, was identified. This was a huge relief, as one theory was that the source might be a broken animal tracking collar.
Incoherent scatter radar echo simulator.
This tower was soon identified as a local FM radio station. The engineer responsible for the station informed us that he had a few weeks ago installed a FSK telemetry link operating at 450 MHz. This was consistent with the appearance of the interference. The faulty telemetry link was aptly replaced by the engineer, and the interferer finally went away!

At about 2013.12.13 13:00 LT, the interference finally goes away as faulty telemetry radio link is replaced on the radio mast in Princeton.
During this episode, we learned a lot about radio direction finding in practice. This will come in handy in the future, as interference is abundant at Haystack.

For software, we used the gnuradio framework. We mostly used the waterfall and FFT spectrum graphical sinks, as the signal was drifting around in frequency a lot. For the war driving, I used a custom block that I wrote, which simply calculates power spectra using FFTW, and records averaged results to disk. I then used post processing of this to calculate the RFI power at any given location. I recorded the GPS coordinates with my phone.

Hastily built front end and rtlsdr digital receiver. The other output can be connected to another receiver, such as a USRP, a HAM rig, or a spectrum analyzer. 
For hardware, we used both rtlsdr dongles, and a USRP N200. The rtlsdr dongle and the gnuradio FFT spectrum sink actually worked surprisingly well for direction of arrival determination. The RF front end consisted of a low noise amplifier and a filter. As direction finding antennas, we used two different yagi antennas, and a magnetic loop antenna. For war driving, we first used a roof mounted discone antenna, and later a magnetically mounted quarter wave dipole.

Yagi antenna (above) used to direction finding by maximizing signal power. The magnetic loop antenna (below) is used to find the angle of arrival by minimizing the signal power, as the antenna radiation pattern has a sharp null in the direction of the loop axis.  
I had already prepared software to record absolute time of arrival of the interferer using GPS syncronized USRP receivers at several independent locations. However, good old fashion detective work with directional antennas managed to provide us with enough clues to solve the problem before we got to deploy our time of arrival setup. Well, maybe the software and receivers can be used to hunt down the spike-like interference that we see every now and then.

Sunday, 15 December 2013

Photos from Inverse Days 2013

The 2013 Inverse Days conference was held in Inari Finland at the Sajos Centre. The new and impressive venue is the Sámi Cultural Centre which is situated on the bank of River Juutuanjoki, close to the heart of the town. Sajos is the centre of Sámi culture and administration.

The conference was busy (over 100 participants!) and full a plethora of new ideas and results. It was brilliant in that the technique of inverse problem analysis applies to many branches of science and there was a range of people there from chemists to applied mathematicians to physicists and many more.

The hectic programme, overwhelming logistics and social schedule meant that  we didn't quite manage to take photographs for the web log. However, we did have a few sent to us later by one of the participants (thanks Virpi!) and we'll feature a small selection of them here.


The Sajos Centre at Inari (Photo: V. Junttila)

Inverse in action! Presentation in the main Sajos hall. (Photo: V. Junttila)

Wall decoration in the other hall in the Sajos centre. (Photo: V. Junttila)

Happy participants... the chap second from right is Lassi, the conference organiser. (Photo: V. Junttila)

More inverse action... here Harri is giving his presentation. (Photo: V. Junttila)

Saturday, 14 December 2013

It must have been a good conference...

Here at the KAIRA web log editorial offices (sic) we've been doing a reasonably good job of keeping up the daily posting of articles, photographs, news and videos. It is a lot of work, but we've always managed to keep on top of it.

However, these last few days, we've slipped behind and there has now been a couple of days where nothing was posted. In fact, for the first time in ages, we've even missed our Friday Photograph.   :-(

Well, to be fair, this can only be attributed to the excellent Inverse Days 2013 conference in Inari, Finland... organised by none other than KAIRA's regular contributor: Lassi Roininen.


We'll get back to our regular posts again tomorrow (including photographs from the conference itself!). And next week we have a brilliant article lined up, with loads of photographs and a very mysterious story behind it.

Wednesday, 11 December 2013

Inverse Days 2013 at Inari

Today, the venue for Inverse Days 2013 has moved to Inari. The conference centre is the Sami Cultural Centre... a lovely building with a very distinct architecture.

Sami Centre, Inari

Tuesday, 10 December 2013

Inverse Days: Thematic day on geospace and atmospheric research

Today is the first day of the Inverse Days, an annual event of the Finnish Inverse Problems Society.  The 19th Inverse Days 2013 comprises of two events:
  1. Thematic day on geospace and atmospheric research in Sodankylä 10th Dec.
  2. Traditional Inverse Days in Inari 11th-13th Dec.
This year's event is characterised by extreme temperature variations between -40 and +3 degrees Celsius. We have had at least one recorded car engine breakdown due to extreme cold. Another maybe also (some smoke coming from the engine)... Anyway, after extreme cold, we will head to plus degrees, which typically results plumbing problems in urban areas! However scientific programme will continue as scheduled!

For more info on the Inverse Days, please visit the event website!
Saariselkä plateau, which we will pass on Tuesday!

Monday, 9 December 2013

Heatwave predicted

Weather alert for Sodankylä! There is a major heat wave predicted for Thursday. The temperature is expected to soar by over 30 deg C above the current temperatures. In fact, it may even go into the positives on Thursday!


I wonder if we can expect ice cream, barbecues, and people sunning themselves in their swimwear on the river bank. After all the sun will graze above the horizon for an hour or so at Sodankylä, which is not yet in kaamos.

Six-element non-redundant array

We've been discussing array layouts recently, with regard to riometry and outlines for LOFAR superstations. There are lots of possibilities of course, but there is one which is rather elegant as well as being practical. Today, we are featuring it here.

The imaging or beamforming properties of an array of antennas is related to the baselines that the array possesses. A baseline is the vector between any two antennas in the array. If an array has 3 antennas, it will have 3 baselines: the baseline between antennas 1 and 2, between 2 and 3 and between 3 and 1. A 4-antenna array will have 6 baselines, a 5-antennas array will have 10 and so on. The number of baselines is related to the number of antennas N by the expression B = N (N-1) / 2.

Although more antennas means more baselines, these baselines may not necessarily be unique. For example, let's imagine 3 antennas, equi-spaced on a line. The baseline from 1 to 2 will be exactly the same as the baseline from 2 to 3. These are referred to as redundant baselines. Although the extra antennas add sensitivity, the fact that the baselines are identical mean they do not add to the imagine quality (i.e. the beampattern).

Finding an array layout with no redundant baselines can be tricky. Even harder, is finding one whose baselines are neatly distributed, thus sampling as much of the baseline parameter space as possible. This parameter space is typically plotted on a graph referred to as a uv-diagram (the differential spatial axes are u and v).

However, there is one which actually has a uniform distribution for a relatively small number of antennas. It is the next logical extension of the 3-antenna equilateral array. The layout of the antennas looks like this:

A manx-array antenna layout (Image: D. McKay-Bukowski)

In the diagram the antenna positions are labelled as 0, 1, ... 5. The antennas themselves are not necessarily hexagonal, but it does fit nicely on a hexagonal grid, thus making it easy to visualise. The baselines for this grid look like this:

The uv-coverage of a manx array (Image: D. McKay-Bukowski)

In the uv-diagram, the baselines are labelled XY, where XY is the baseline for Antenna X - Antenna Y. As you can see, the baselines are equispaced with no redundancies.

I was introduced to this array by Björn Gustavsson (UiT), but I don't have a reference for who came up with it originally. We tend to refer to it as a Manx Array, owing to the similarity between the antenna layout and the triskelion that appears on the brattagh Vannin (the flag of the Isle of Man). But if anyone has any original references, please let us know!


PS:  It is delightful to work with hexagonal grids. It takes me back to the old days of playing with hexgrid-based games.

Sunday, 8 December 2013

Winter lights in Oulu

At this time of the year,like most places, cities and town put up lights to celebrate the round of winter festivals. Oulu is no exception.

Last week, a small group of staff from SGO went down to the university there for meetings and to sort of various administrational matters. Today's photograph is from the city centre, a shot taken during that trip.

Oulu city centre

One of the notable moments of the trip, though, was the pseudo-earthquake that ripped through the city during the mid-evening. Around 21:00, there was an incredible noise, combined with a complete shaking of the building that we were in.

We were told shortly after that this was subterranean blasting work, as the city is building an underground carpark. Still, it was quite something to feel the shockwaves of the blast.

Saturday, 7 December 2013

Under the lamp-post

Another snowy scene today. Arriving back at the Biological Station the other night, the piles of snow and the ploughing around the car park caught my attention and have become the photograph for today.

Entrance to the Biological Station (Photo: D. McKay-Bukowski)

Friday, 6 December 2013

LBAs in the snow

Friday again! And time for a nice photograph. This photograph was taken about a week ago, showing the Low-Band Antenna aerials in the snow. The time of day was midday, but we were already in kaamos (= polar night) by that stage, hence the twilit landscape.


KAIRA LBA aerials in the snow (Photo: D. McKay-Bukowski)

Have a nice weekend everyone!

Thursday, 5 December 2013

Inverse Days abstract book

The Inverse Days abstract book has been published in the Sodankylä Geophysical Observatory report series. It is the report No 61 and available as an ebook (pdf) at Jultika, the University of Oulu e-publication database. A paperback version is also available for the Inverse Days participants.

If you want to find more information on Inverse Days, please visit the event website!

KAIRA for Stellarium

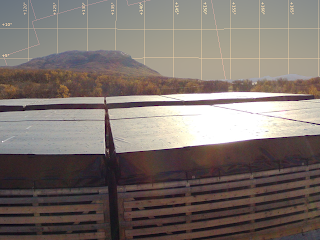
The desktop planetarium "stellarium" is a beautiful way to view the sky from any location and for any time. It also has the added feature of being able to add your own landscapes, thus giving correct horizon views.

Quite some time ago we did this for the KAIRA High-Band Antenna (HBA) array. The result is an Autumnal view of the KAIRA site, from the mid-point of the HBA array.

The view from KAIRA... completely in software! (Image: D. McKay-Bukowski)

You can download the KAIRA HBA landscape (link) for your own version of Stellarium. We plan to create an LBA version sometime in the future.


Ref:  http://www.stellarium.org/