Showing posts with label LBA. Show all posts

Wednesday, 3 September 2014

LBA repairs

Well, as reported, the jänis had struck twice and that meant lots of repair work for us. Actually in total there were 14 x LBA aerials to fix.

Status on 27-Aig-2014

The storm damaged ones were the most work. There required fitting new connectors (the old ones had been ripped clean off during the impacts). The jänis-attacked LBAs were more numerous, but less time consuming.

Repaired LBA line (Photo: D. McKay-Bukowski)

The fix was adding a new length of nylon guy line. A double-fisherman's bend is used to join the new section of line to the old and a bowline is used to make the loop to hook over the peg.

To discourage the jänis from simply biting through these again, we smeared the lines with a combination of spray lubricant and grease. This is waterproof and should give a bad smell and texture, thus deterring further jänis attacks.

However, in the long-term, we'll still need to work out a better way of protecting the LBA aerial lines.

Tuesday, 2 September 2014

Jänis attacks!

Last week we made a service visit to KAIRA. There were four LBA aerials still down from the blizzard of 2014 and these needed fixing. However, on arrival at the site, we noted that there were some other LBA aerials down.

What?!

We hadn't noticed this in the data, so it must have been recent. And inspection of the field indicated that the nylon lines had been cut on multiple LBA aerials, which is what had caused them to fall.

A cut LBA line. (Photo: D. McKay-Bukowski)

Field of woe. (Photo: D. McKay-Bukowski)

We believe that the cause of this is a jänis (Wikipedia). These creatures like to gnaw on things and it looks like the LBA array was the target. Knowing our luck, it was probably the cute jänis we saw a while back.


What's worse, on the second day, we found yet more LBA aerials down. The jänis had struck again! (This led to much silliness on twitter.)

In total, some 10 LBAs were downed over two days (26-27 Aug 2014). More repair work for us then.

Friday, 29 August 2014

Typical KAIRA

Today's photo has a bit of everything. The LOFAR HBA tiles, the LBA array in the background, Saana dominating the horizon, the storage containers and site area, and our trusty observatory vehicle.

The KAIRA site (Photo: D. McKay-Bukowski)

Thursday, 21 August 2014

LBA aerials

KAIRA has 48 low-band antenna (LBA) aerials. These were designed by ASTRON (the Netherlands Foundation for Radio Astronomy). The arrangement of the aerials looks pretty random, but in actual fact it has been carefully chosen to give a good beam-pattern for the radio telescope. Each aerial comprises a steel grid which acts as a ground plane for the aerial. The post is PVC (starting to fade in places due to UV-light exposure) and the black cap at the top contains the low-noise amplifiers (LNAs) - one for each polarisation.

The wires that extend from the cap to the corners of the ground planes are the antenna wires. The form crossed inverted-V dipoles, giving good all-sky sensitivity. Actually the wire part only goes about halfway down. The lower part is either nylon line or elastic, which is used to hold the aerial in place.

Low-Band Antenna (LBA) at KAIRA. (Photo: D. McKay-Bukowski)

Tuesday, 8 July 2014

LBA height re-survey results

Recently we showed a photograph of the re-surveying of the heights of the Low-Band Antenna (LBA) array at KAIRA. Today, we have the results from that survey.


The plot shows the heights of each antenna in the array with respect to the average height. For the purposes of a phased array, the relative positions are important. Our concern had been that freezing/thawing of the ground would result in shifts in the surface. Additionally, there might be some subsidence on the side where the mound had been built up to match the main field height. In these cases, it is possible that the soil is not sufficiently well packed and that it sinks slightly as it settles further.

As can be seen from the data, the heights are all within the +/- 3 cm specification.

Friday, 4 July 2014

Re-surveying the LBA

As part of the summer maintenance, we surveyed the LBA heights. One of the concerns was that the freeze/thaw cycle in the soil and gravel that supports the LBA would cause subsidence or a minor 'palsen' effect which in turn would distort the array field.

To carry out this test, we used a laser level and investigated the relative heights of the different aerials. This task was carried out by some of our summer workers.

Conducting the LBA survey with the laser level is in the foreground. (Photo: D. McKay-Bukowski)

Wednesday, 2 July 2014

Securing the LBA

We attempted to effect repairs on the KAIRA LBA, but we were short of some parts (cable connectors), which meant that some aerials needed to remain down.  In order to ensure that the existing parts were secure, we used tape and rocks to prop up the posts and permit water drainage. It looks a little odd, but it works!

The few remaining damaged LBA aerials (Photo: D. McKay-Bukowski)

At present, we have 1 tile and 4 aerials out of action. We hope to repair the LBAs in July/August and we are waiting on a quote from ASTRON for a replacement tile.

Friday, 27 June 2014

LBA in the summer sun

Today we have just a nice photograph of the LBA aerials. In the background is Pikku Malla.


Have a nice weekend everyone!

Tuesday, 10 June 2014

Aerial #L21 replaced

At 21:20 EEST, we replaced LBA aerial #L21.

Monday, 19 May 2014

Further investigations on the strange solar ripple

We've been following the progress on trying to understand a strange ripple in some recent solar observations.


As each antenna has two polarisations, we plot first the X-polarisation and the Y-polarisation. They are done separately, to avoid a strong flickering effect (which is due to the different responses to the event between the two polarisations).

The "RCU" number is the Reciever Unit number. The even RCUs are for the X-polarisation and the odd ones are for the Y-polarisation. Three RCUs have been omitted (68,69, and 70) as these were offline at the time the observations were made.

Actually, we noticed that they oscillate. The oscillation is small to start with and then it increases. The movement is small, but those fringes waver with RCU number.


RCU number is a function of the antenna number.

   RCU 0,1 = LBA #L00
   RCU 2,3 = LBA #L01  
       :
       :
   RCU 94,95 = LBA #L47

And, if you look at the map of the array, and join the dots in numeric order, you get this:


So, then what I did was to look for where the minimum fringes and maximum fringes occur. In other words, as the pattern moves up and down, what are the local min/max points in that oscillation.

I noted the RCU numbers, determined the antenna numbers and plotted them. I also note the direction of the sun during this time (roughly).


This tells as that the fringe pattern is associated with distance from the sun. Well, it is not likely to be that directly, but because there is a mound with the LBAs, there will be more flat ground between #L43 and the sun than #L35. This snow/ground could be causing reflections.

What these results tell us, though, is that the original hypothesis of a reflection off the reindeer fence or gate is actually pretty unlikely.

So there are now two likes of thought. One is that this is a snow effect and some modelling is going on to investigate this.

The other is that it is an ionospheric refraction effect.

Neither idea is firm yet and investigations remain ongoing.

Monday, 12 May 2014

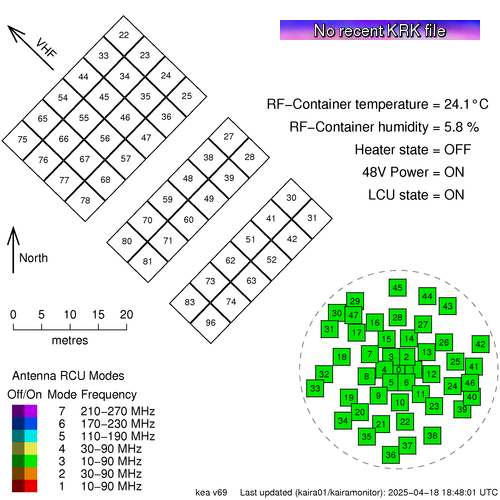
KAIRA Status Map

We have a new status map showing the situation with KAIRA.

This shows the actual current status:


This is available from the Status page, which can be found in the title bar of this web log.

The map shows the array layout of the antennas. The High-Band Antenna (HBA) tiles are in the top left and the Low-Band Antenna (LBA) aerials are in the lower right.   The layout is to scale, which is shown, and the direction to the VHF transmitter at Tromsø, is also indicated.

The antennas are numbered and they are also colour coded to show the Receiver Unit (RCU) mode. KAIRA has 96 RCUs and the RCU mode indicates which combination of antenna plus band-pass filter is used for the processing. Sometimes the entire array is configured to a single RCU mode and at other times it is mixed with several different modes for different antennas.

If an antenna is enabled, then the colour is bright, but if it is switched off, then it is dulled down.

In the case of a plain grey antenna icon, this means the antenna is shut down, either for maintenance, or as a result of damage.

Sometimes an antenna might be shaded with two colours like a two-tone maritime-Z-pennant. This is because each antenna has two polarisations, and there will be occasions when the RCU number/status for each polarisation is not the same.

In the bottom left, there is the legend and in the top right is the status label and the current RF-container parameters.

The image at the start of this post is "live". If you update the page, you might see ti change, depending on what KAIRA is doing. But to give an indication of what the status map might look like, here are some other static examples:

A "357"-mode solar observation. The grey antennas
are those knocked out by the March 2014 blizzard.

A mode-3 riometry observation. Storm-damaged antennas
are also present in this particular example.

Monday, 5 May 2014

Curious ripple in the data

The strange ripple in the dynamic spectrum of the solar radio event from a few weeks back has caught some interest, and we don't have an explanation for it... yet. At first, it was thought it might be an RFI effect, although it is very broad. It also drifts in frequency, which is unusual.

These data are from a single dipole. So, it might be coupling between that and other dipoles, or perhaps Cas A rippling through a sidelobe. For the UK station (which doesn't see the effect -- REF), these sources would be at different position angles. There are several things we have now checked:

We see it on different dipoles. These might have different couplings (due to antenna spacings) or be at different position angles (with respect to, say, a local RFI source).

We also see it on both polarisations. The following two plots are from different polarisations.

LBA aerial #L04, X-polarisation (Image: D. McKay-Bukowski)

LBA aerial #L04, Y-polarisation (Image: D. McKay-Bukowski)


We may still be seeing some sort of ground effect or perhaps a reflection from the reindeer fence. Alternatively, it might be a "snow interferometer" (like the old sea-interferometer, but with a reflection off the snow). The fact is that the sun is at quite a low elevation and the wavelengths are quite long at these frequency bands.

In any case, we remain puzzled. Any suggestions, anyone?

Monday, 21 April 2014

Spectacular solar radio event

Last Friday, KAIRA observed the most amazing radio event from the sun. There was a strong X-ray event, which corresponded to an amazing multi-frequency solar event in the radio. The following plot is from the GOES X-ray monitor (source: NOAA/SWPC)


The event was detected at KAIRA and the following plot shows the entire event sequence.

KAIRA detecting of the solar radio event (Image: D. McKay-Bukowski)

The initial event was preceded by a smaller, fainter event. However the first of the strong radio bursts was very strong and mostly uniform in frequency distribution.

Zooming in on the initial event (Image: D. McKay-Bukowski)

 The subsequent events were much more complicated. In particular, there was a very slowly decaying radio event, which cascaded down through the different frequencies of the Low-Band Array (which was operating at the time).

The main event... very complex! (Image: D. McKay-Bukowski)

What is really curious is the ripple effect through the different frequencies. Is this an interferometric effect from the coupling between antennas? However, these data were taken with a single LBA aerial.

It will be interesting to see what auroral activity occurs over the next few days. Although it is getting close to the midnight-sun season, KAIRA will be able to monitor the events using the new riometry modes.

Overall it was a very interesting event. We will be conducting a number of dedicated solar observing events over the summer with KAIRA, so hope to report on more solar data in the next few months.

Friday, 4 April 2014

The KAIRA snowscape

It's Friday again and, after a dearth of Friday photographs, we've an absolute treat for you today.

Back in November of 2013, we ran an extended campaign at KAIRA with the University of Southampton, observing pulsars, incoherent scatter radar and various riometry experiments. On one morning, we actually had some clear weather, giving us a chance to take some photographs. And today we feature one of these.


KAIRA 2013-11-03 (Photo: D. McKay-Bukowski)

The photograph was taken on 3rd November 2013, and shows the Low-Band Antenna (LBA) array in the central foreground with the HBA behind it and a bit to the right. It is also possible to see the site containers too. The mountains in the background are (from left to right) Pikku Malla, Iso Malla and Sallorássa. The first two are in Finland and the latter is in Norway.

You can click on the above image to see a somewhat larger version. However, for those who really want high-resolution, we have a 3200x1000-pixel version (4 MB) at the KAIRA press-and-media page. Or, if that is not enough, we also have a huge 9600x3000-pixel version (30 MB... Warning: this image may take a while to download). Oh, and a big thank-you to Poppy Martin (U. Soton) for lending her amazing camera to me in order to make the image.

Have a nice weekend, everyone!

Wednesday, 26 March 2014

Radio bright sun -- Part 2

Yesterday we showed some KAIRA data of a very active sun. It was so bright that it easily outshone Cas A and Cyg A. Given this, we surmised it should be possible to see the solar signal with a single dipole.

Sure enough, that was the case.

The following plot shows the subband statistics for a single antenna (LBA aerial #45, Y-polarisation).


The vertical axis is frequency, shown as both the subband number (left-hand side) and frequency in MHz (right-hand side). The broad band of noise between 8 and 25 MHz (approx.) are the sum of countless shortwave radio transmissions. Below 8 MHz and about 80 MHz, there is little signal due to the LOFAR RFI suppression filters and the weaker amplifier and aerial responses.

Monday, 17 March 2014

Mapping the RCU number to the LBA/HBA number

Each polarisation from each antenna is processed by a separate channel. The electronics on this channel is called a Receiver Unit (RCU). KAIRA has 96 RCUs (numbered 0..95).

When looking at the signals coming into the system, they are labelled by their RCU number in the first instant. One needs to map this to the antennas to work out which antenna/polarisation is being shown.

The polarisation mapping is straight forward... even numbers for X-polarisation and odd numbers of Y-polarisation. However the match between the RCU numbers and the antenna numbers is a bit more confusing. Yes, there is a logic, but it is not obvious. Sometimes it is simply easier to look it up!

So, here is the mapping of RCU to antenna number for KAIRA (the scheme is different for other LOFAR stations).


For where those antennas are on the actual site, refer to the array layout map.

Sunday, 16 March 2014

Map of the 2014 KAIRA storm damage

Today, we've plotted where there has been damage to KAIRA. The map is a bit scary, but actually as we have seen from yesterday things are not so bad and we've come out of it fairly well.

As can be seen, we have lost two antennas completely. These are tile #H75 and aerial #L34.

We've had two aerials (#L05 and #L21) seriously damaged. These will need to be replaced.

There are three aerials (#L22, #L35 and #L36) which have been damaged but have been repaired to the point where they are operating normally again. However additional work will be required in the summer when the snow has melted and we can access them properly.

There are many aerials with minor damage. The aerials are still operational, but will require some attention in the summer to ensure they remain robust for the following winter. The problem has been buffeting to the aerial wires causing cracks in the PVC moulding and coatings. These can be patched, but it does require warmer weather.

Saturday, 15 March 2014

System status

Following the storm and the repair work, we carried out remote system checks for the bandpasses for all antennas. Here are the results, starting with the High-Band Antenna (HBA) array:


As seen, RCUs 80 and 81 (= tile #H75) remain dead. These are the two channels from this destroyed tile.

Here is the Low-Band Antenna (LBA) array results:


Here you can see RCUs 68 and 69 (= aerial #34) remain dead. This aerial was destroyed and we have not even found the remains of it! Following repairs, there remain two other damaged signal channels. These are RCU 11 (= aerial #L05, Y-polarisation) and RCU 42 (= aerial #L21, X-polarisation). These two aerials have suffered broken wires and are thus impared in this polarisation. Temporary repairs have been effected, but more work remains to be done.

However, in total, we only have lost 6 out of 192 signal channels. Throughout the storm and the repair work, KAIRA has continued to observe our riometry and interferometry programmes. That's pretty good.

Thursday, 13 March 2014

Correlating gusts and failures

From the last few days, we've been looking at the loss of signal from the LBA aerial #L34 and today we've correlated that with the wind-gust speeds. Although the average speed is often of interest, it is the gusts that usually determine points of failure or direct damage.

In the graph we have plotted the 10-minute gust maxima for Kilpisjärvi village and Saana mountain (the two nearest official weather stations to KAIRA). Also plotted is a vertical line showing the point at which signal was suddenly lost from LBA aerial #L34.


Not surprisingly, it corresponds to a strong peak. However it is good to note that we tolerated up to that value and that the failure did not occur earlier at lower gust speeds.

The failure time is slightly ahead of the peak. This also not surprising, as the weather stations were both downwind of the KAIRA site (by a few km) at the time of the failure.


Data courtesy from the Finnish Meteorological Institute (www.fmi.fi)

Wednesday, 12 March 2014

Moment of death

We trawled back through the subband statistics (SST) data to find the exact instant that LBA aerial #L34 was destroyed. The critical moment seemed to be around 18:50:20 UTC.


As can be seen, there is a possible preliminary event some 12 seconds earlier. Not sure what this could have been. Flying debris, perhaps?

In any case, this was the point when we lost aerial #L34, which probably was due to flying debris  from tile #H75.